
This report summarises the findings of our analysis of the atomic arbitrage space in Osmosis done in collaboration with Numia Data . The study aims to learn more about the atomic arbitrage space in Osmosis and understand the competitive landscape. Based on our findings we were able to identify what accounts are the most profitable ones arbitraging on Osmosis, how big their profits are, and how these correlate to the validator proposing the corresponding block. In addition, we looked at the error rate of the transactions submitted by these arbitraging accounts. We found that the majority of the transactions they sign result in errors, occupying most of the blockspace.
Definitions & Assumptions
- An arbitrage transaction is defined as a set of swap messages in a block from the same account which produces a cycle:
asset_a => asset_b => asset_c => ... => asset_a
- This analysis only takes into account $OSMO as the input asset (
asset_a)
- This analysis looks at data between June 1st and August 31st 2022.
- This analysis only takes into account swaps performed within the same transaction
- We explicitly look at Osmosis message type
/osmosis.gamm.v1beta1.MsgSwapExactAmountInand extract the data related to the event_typetoken_swappedtriggered by the Cosmos SDK
- The profit calculated is purely a trading profit based on the input amount of the corresponding asset and the output at the end of the swap chain. Gas fees are not taken into account.
- An arbitrage trading address is identified as an address that performs an arbitrage transaction within a specific time period.
- Failed transactions do not emit events, so it was not possible to identify arbitraging trades that failed. In order to learn more about errors, we looked at all the transactions of the unique addresses that we identified as arbitrageurs.
Analysis
The Analysis is split into 5 different areas
1. Market Size & Key Metrics
Overall Market Size
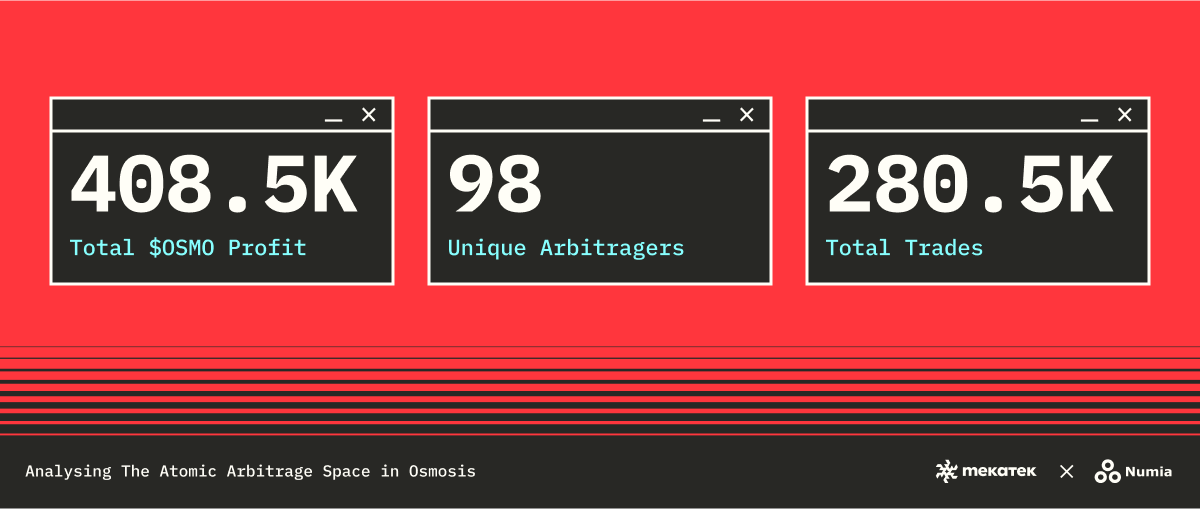
We identified 98 unique arbitrageurs that in total performed over 280K arbitrage trades and made an average profit of 4,168 $OSMO between June And August 2022.
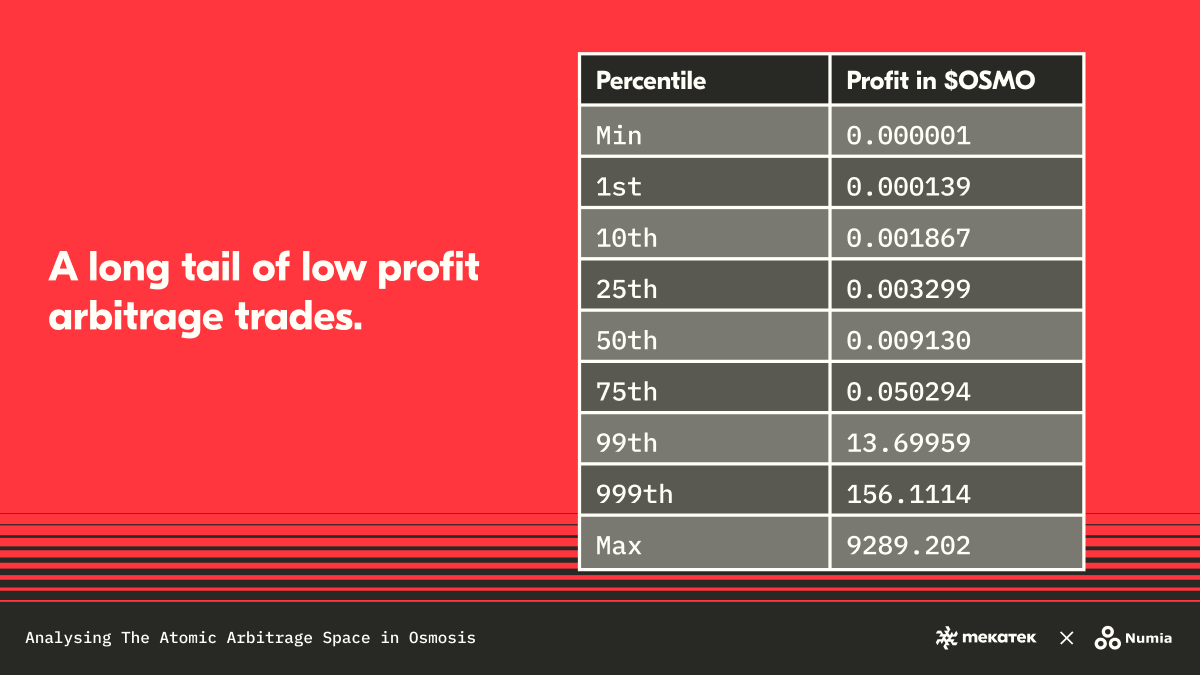
Percentile Distribution of Profit per Trade
When looking at the distribution of the profits we see that 75% of the trades make a profit lower than 0.05 $OSMO, however
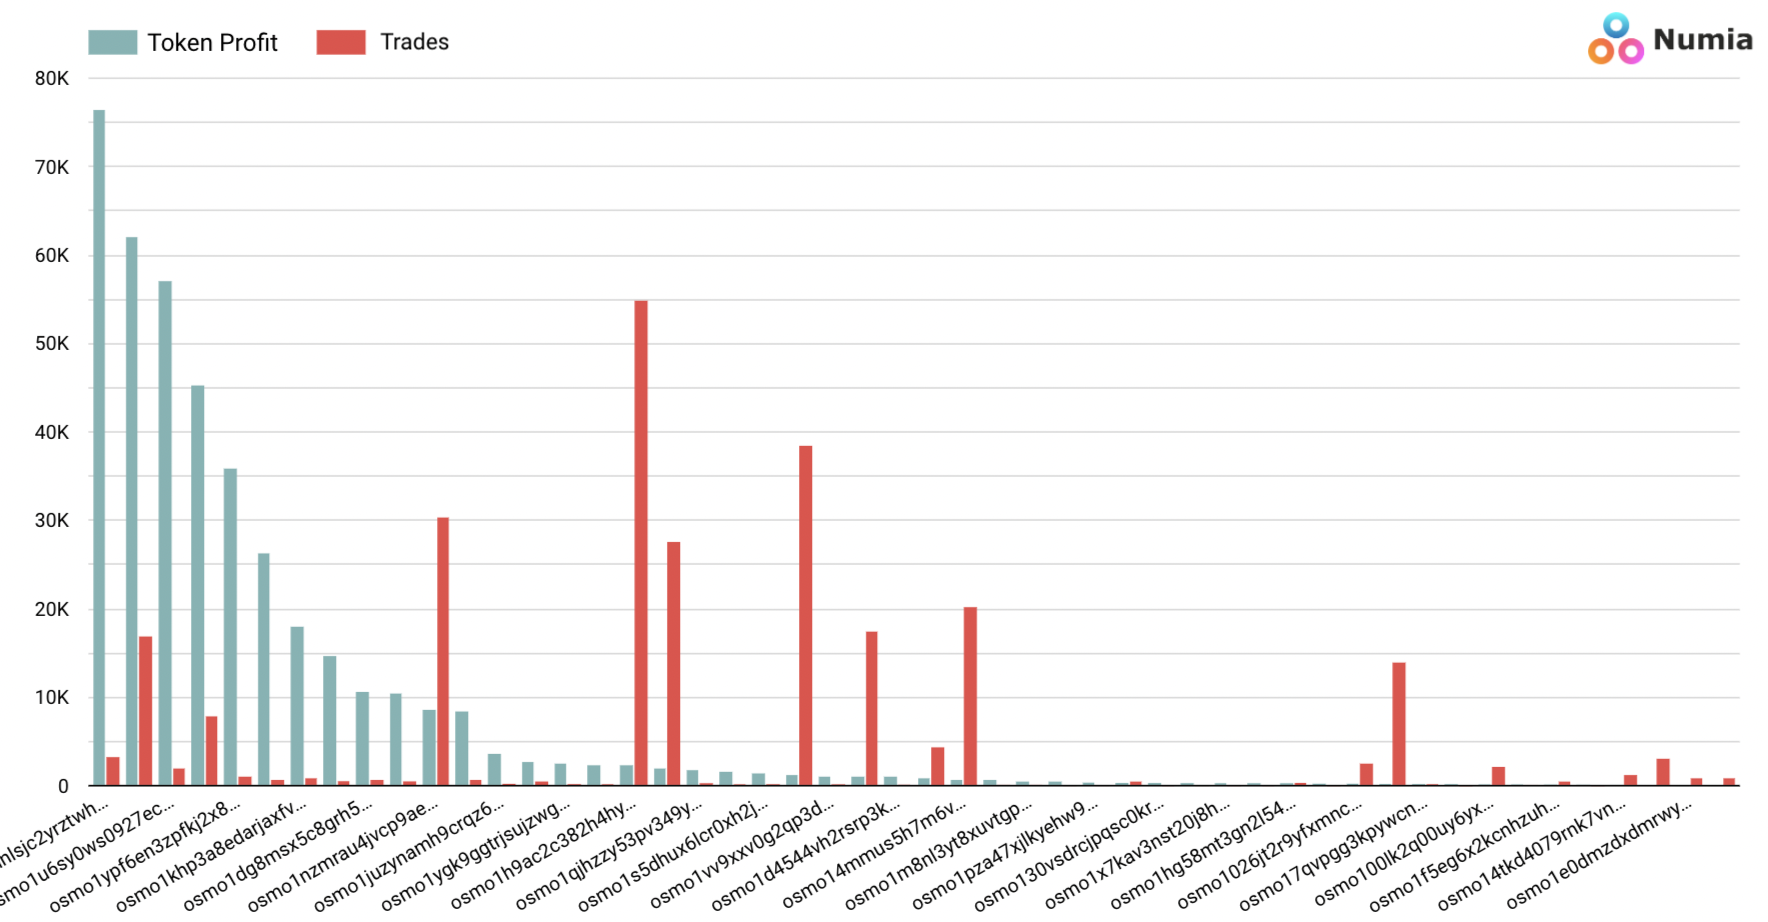
2. Trader Profit & Efficiency
The profit extraction is highly concentrated as the top 5 traders extracted 2/3 of the total accumulated profit. The difference in the efficiency measured as the average profit per trade is also quite remarkable and suggests that traders use a variety of different strategies. For instance, the top trader only needed 20% of the number of trades compared to the second most successful trader and outperformed them by 23% in absolute profit.
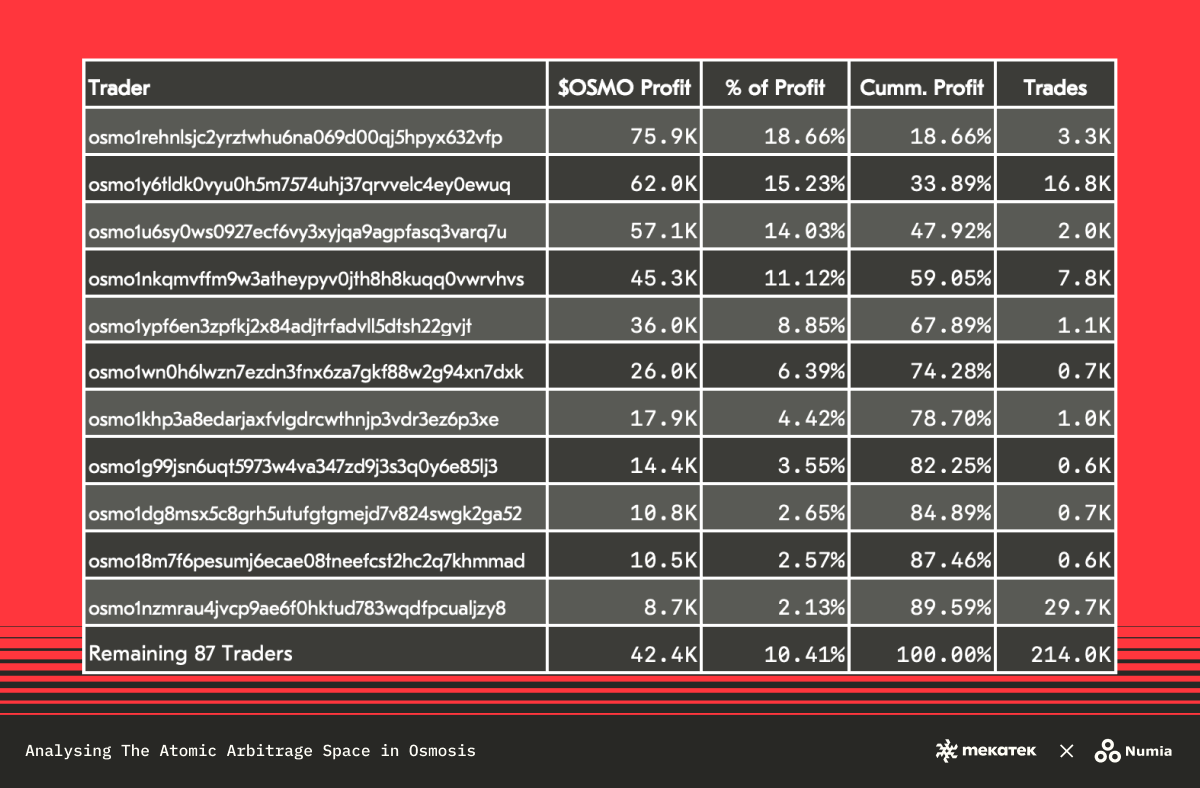
Additionally, as we move down the table we start seeing a drastic decrease in efficiency, having the bottom 87 traders (out of 98) perform 77% of the trades and only accrue 10.4% of the profit. As a next step, we will compare the most effective traders to the least effective ones to understand in more detail the difference in strategies.
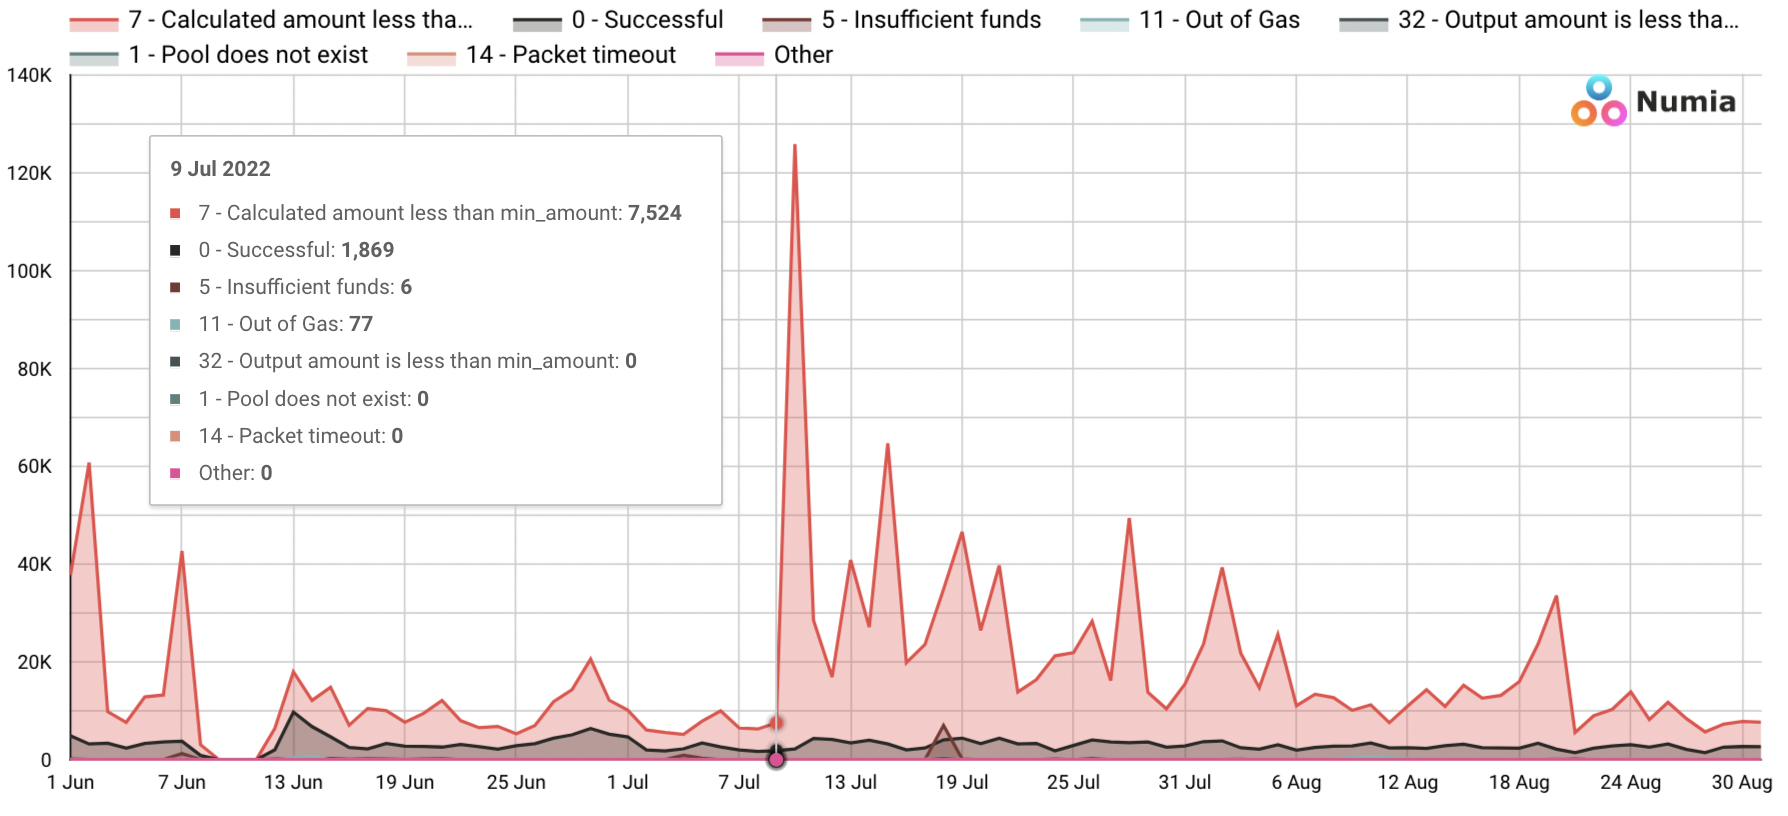
3. Error Rates
We identified that arbitrageurs submitted approximately 2.2M transactions between June 1st and August 31st, 2022. 85% of these transactions failed which indicates how inefficient the blockspace usage is in Osmosis. The most common error with a share of 98% is transaction code 7 - "Calculated amount less than min_amount" which is the minimum output amount predefined by the trader contingent for the transaction to go through. We still need to research deeper to understand if this is due to some of the traders being front-run or something else.
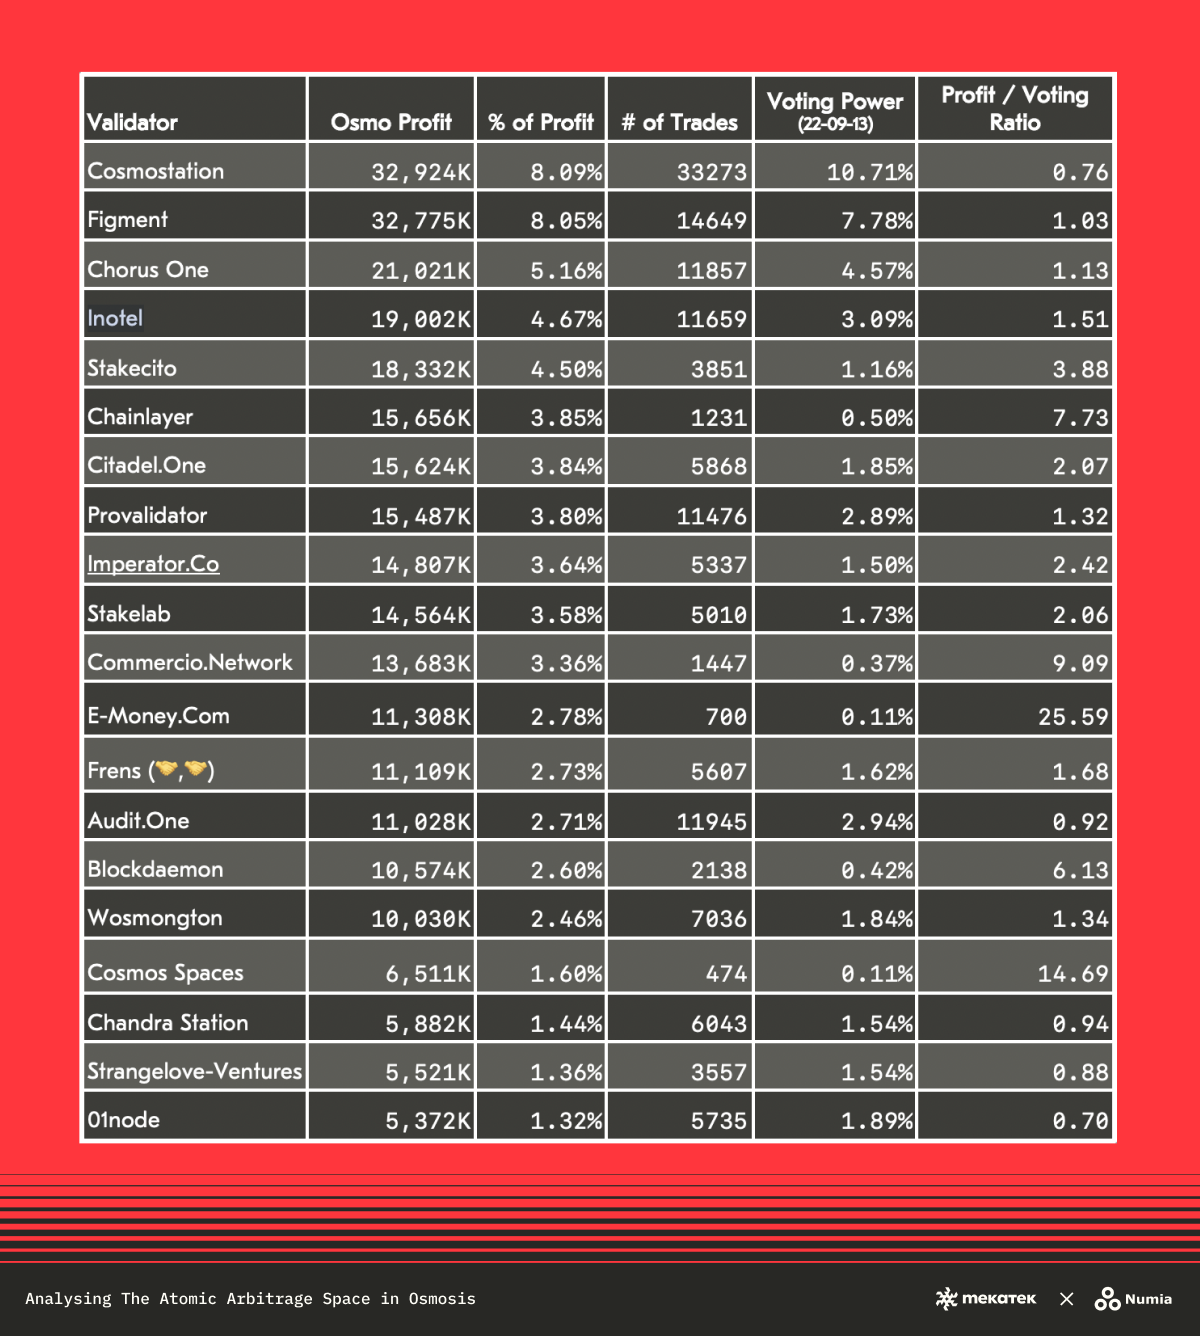
4. Profit by Block Proposer
The top 10 validators control 49% of the profit in arbitraged $OSMO, whereas the top 10 validators control 41% of the voting power. We need to dig deeper to understand if the difference in distribution is due to validator intervention or not, but so far at least we are able to identify a difference. The following table shows the top 20 validators by voting power and their corresponding profit calculated as the sum of the arbitrage profit in the blocks they validate.
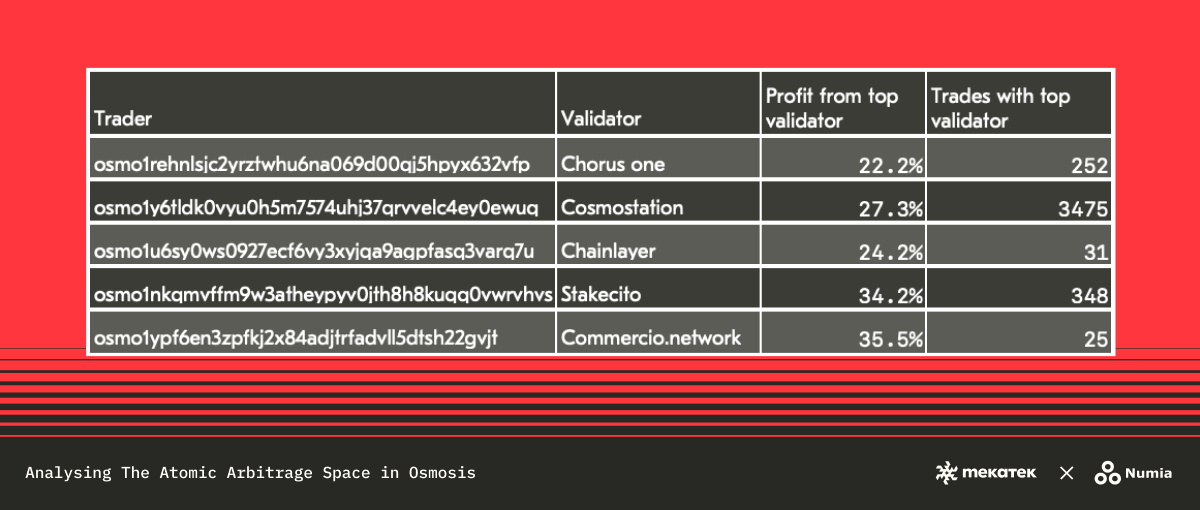
Correlation of Traders and Block Proposers
We also looked at how validator profit correlates with trader profit and found out that the top 5 traders extract on average 28% of their profit from one single validator. Worth mentioning that each trader has their own top validator.
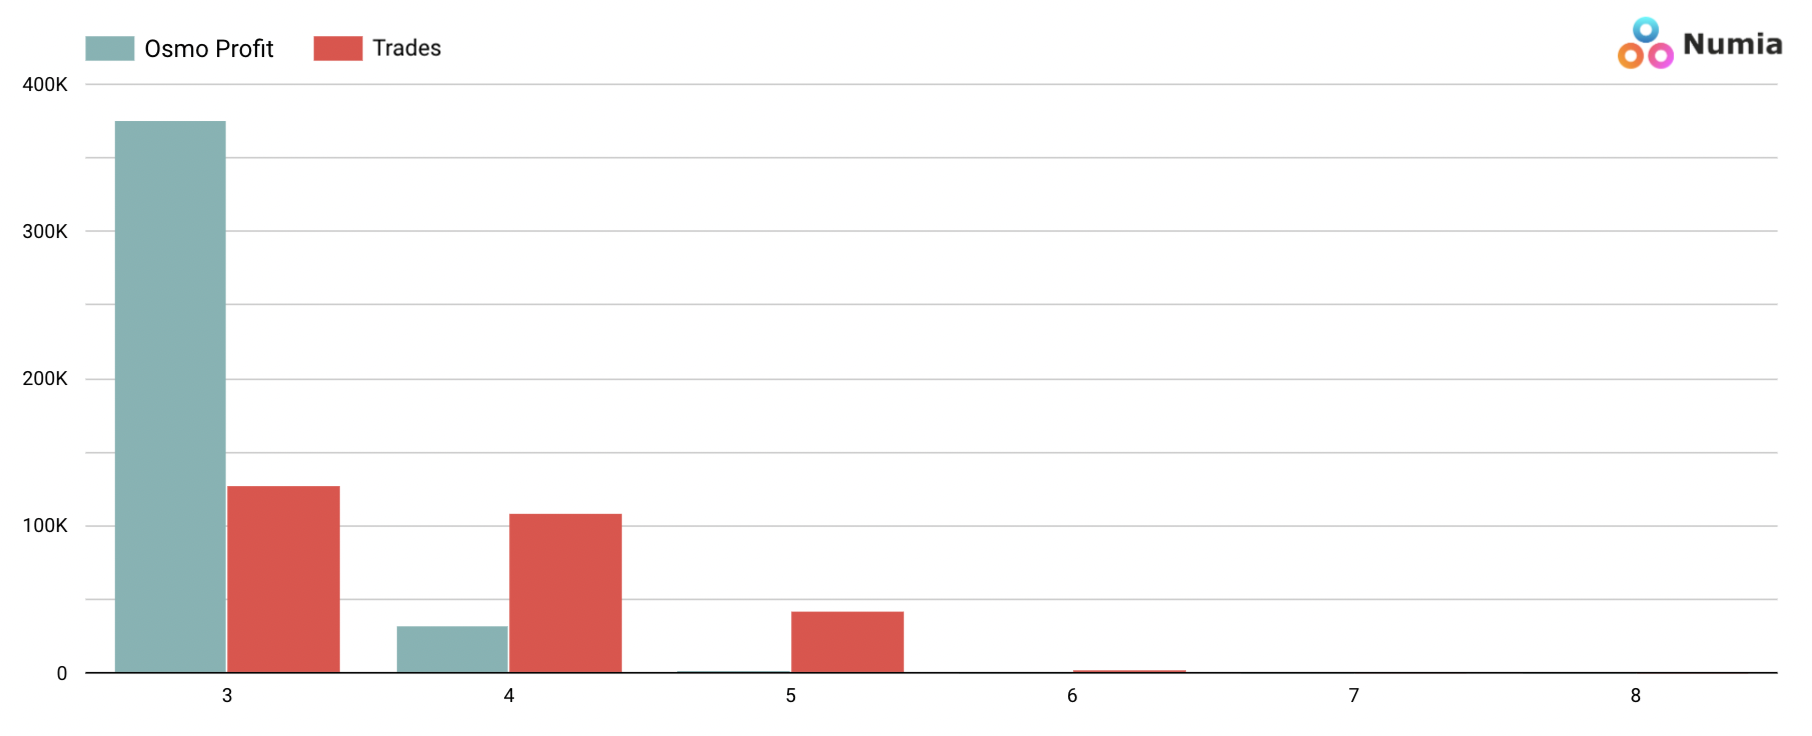
5. Trading Paths
Finally, we were able to identify that most of the profit is extracted from 3-hop swaps rather than longer paths. Even 4 and 5-hop swaps seem to be substantially less efficient.
Takeaway
The fee market in Cosmos doesn’t work for validators. Utility of the blockspace is not priced in a way that reflects its actual value. This in turn leaves validators with the burdens of extraction: wasted storage, network bandwidth and meaningless execution.
A competitive fee market avoids these extractive outcomes. Only by aggregating the overlapping preferences of a heterogeneous set users, validators as well as relayers, can we ensure that value is distributed proportionately to the supply chain.
We will continue our research efforts - with the support from Numia - to find answers to that problem, as this is just the first step in bringing transparency to the dynamics of value extraction in the Interchain.